ServiceDesk Simulator

The Support Toolkit · Module 9 of 16

Server Room

The judgment that gets people promoted: telling one broken laptop from one broken floor. Infrastructure is where you check.

Two tickets land a minute apart. One says the WiFi keeps dropping, the other says a video call died. Deciding whether that is two problems or one is the judgment this module is about.

Part one

On the job

Infrastructure seen from a first-line seat: what is physically in a rack, how the wires run, where the single points of failure hide, what monitoring is telling you, and how a major incident is actually run.

What is actually in the rack

How close you get to the rack depends on the employer: some desks hand out the key in your first week, others keep the room behind a badge you will never hold. Either way you have to picture what is behind the door, because every escalation you write is read by someone who works there. A rack is a vertical frame of standard-width slots, measured in rack units, filled roughly in the same order everywhere.

One rack, roughly top to bottom

Patch panel Where every cable from the floor terminates. The wall socket at somebody's desk ends here, and a patch lead jumps that port to a switch port. Half of "the network port is dead" ends in a patch lead somebody unplugged.
Switch What every device on a floor plugs into. Access switches serve desks and phones; distribution or core switches join them together. This is the device whose failure takes out a whole floor at once.
Router Moves traffic between networks, including the one that leaves the building. The edge or border router faces the internet circuit.
Firewall Sits between inside and outside and decides what is allowed through. Usually a pair. It gets blamed early in most outages, and the fault is usually further down this list.
Servers Domain controllers, file servers, mail servers, print servers, hypervisors running dozens of virtual machines on a handful of physical hosts. Each one is a service some group of users cannot work without.
UPS Uninterruptible power supply: a battery between the wall and everything above it. It carries minutes, enough for a generator to start or for the servers to shut down cleanly.
PDU Power distribution unit: the power strip of the rack, often two of them, one per feed. Which PDU a device is plugged into decides whether your redundancy is real.
A branch office is one half-populated rack in a cupboard. A head office is a room of them with cold aisles and a door that logs who opened it. The parts list barely changes.

Where the wires actually run

One cable from a desk to the internet passes through the same five things every time.

One desk PC to the rest of the world

Wall port
Patch panel
Access switch
Uplink
Core
The wall port runs back to a cabinet on the same floor, the floor closet, which the cabling trade calls an IDF. The switch there is an access switch: it serves that floor, which keeps every desk cable short. Its uplink is one or two higher-speed ports carrying all of that traffic onward to the core, which lives in the main room, the MDF.

Forty-eight desk ports at a gigabit each feeding into a single ten-gigabit uplink is normal and fine, because desks are idle most of the time. It stops being fine on the morning everyone on that floor syncs a large file at once, and it looks exactly like "the internet is slow".

Traffic is then separated into VLANs, virtual networks that share the same physical wiring: one for desks, one for servers, one for wireless, one for phones, one for cameras. Two machines plugged into the same switch can be on different networks, and a routing or firewall rule between those VLANs is what lets them talk. When a whole category of device breaks at once, "which VLAN are they on" is a better question than "which floor are they on".

Wireless has a second layer. Access points look like just another device on a switch port, but they are usually managed by a controller, physical or cloud. An access point can be up, powered and healthy while the controller it depends on is not, and then a whole building loses WiFi with every AP light still green.

Single points of failure, and redundancy that only exists on paper

A single point of failure is any component whose failure takes the service with it. Finding them is mechanical. Put a finger on a user's desk on the diagram, trace the line to whatever they are trying to reach, and count everything you pass that there is only one of.

From a desk to a website that is usually: the patch lead, the floor switch, its uplink, the core switch, the firewall, the edge router, the internet circuit. Seven things, and in a lot of small offices six of them are single.

Six single points is often the right answer. Redundancy costs money and complexity, and a fifteen-person office runs perfectly well on one firewall. The thing to check is whether somebody wrote the list down, so that on the day one of them fails the recovery time is already known.

The trap is redundancy that only exists on paper. Two of a thing is redundancy for as long as the two are separate all the way down.

A pair, and the thing underneath it

Two of a thing

  • Two firewalls.
  • Two domain controllers.
  • Two internet circuits, two providers.
  • Two of anything that takes the same config push.

What they share

  • One rack, one PDU, one wall circuit. One power fault from zero firewalls.
  • The same hypervisor host. One host from nobody logging in.
  • The same duct out of the building. One contractor with a digger.
  • The same moment, so they take the same bad config together.
Ask it of every pair: power feed, rack, room, uplink, hypervisor, provider, change window. Whatever they share is the real single point of failure.

What you run on the machine

Before you open the monitoring board there is a machine with a user in front of it, and a short sequence of commands names the fault.

ipconfig /all

Three lines carry most of the answer. An address starting 169.254 is APIPA, automatic private addressing, which the machine gave itself because no DHCP lease arrived: look at the port, the switch and the DHCP server. A blank default gateway leaves the machine stuck inside its own subnet. The DNS servers listed are what it will actually ask.

The ping ladder

Loopback
Gateway
A public IP
A name
Climb it in order, because a rung that answers proves the rungs before it: loopback proves the machine's own network stack, a gateway reply adds the patch lead, the port and the switch, and a public address on top of those adds routing and the circuit. The first rung that fails is where the fault sits. When ping by address answers and ping by name fails, the fault is name resolution.

nslookup pointed at a server you name asks that resolver, not the one the machine was handed. ipconfig /flushdns drops a stale answer. tracert shows where the path stops.

You will usually talk somebody else through it. Much of the time you are spelling these commands down a phone and having the user read each line back: the blind talk-through from The phone.

DNS, past the first sentence

DNS turns a name into an address, and an interview will go a question or two past that.

The resolver is the server your machine asks. It answers from cache when it can, and otherwise walks the hierarchy for you: the machine makes one request and waits.

RecordWhat it holds
A A name to an IPv4 address. What a browser needs, and what most "the site will not load" tickets turn on.
AAAA The same job for an IPv6 address. One name can carry both an A and an AAAA, and the machine picks which to use.
CNAME An alias: one name pointing at another name, so several names can ride behind one A record.
MX The mail servers for a domain. Wrong, and the website is fine while mail bounces.
PTR The reverse lookup, an address back to a name. Mail servers lean on it to judge whether a sender looks legitimate.

Answers carry a TTL, a time to live, the seconds they may be cached, which is why a correct change "has not worked yet": resolvers keep serving the old address until their copy expires.

Active Directory runs on DNS. The domain controllers are usually the DNS servers as well, and a client finds one to log in against through SRV records, the service records the domain publishes. Point a machine at the wrong resolver and it cannot find a controller to authenticate against, which is why "I cannot log in" so often turns out to be DNS. It is a favorite interview question for exactly that reason.

Monitoring, and what "a node is down" means

Somewhere there is a system watching all of this, and on a good day it pages somebody before a user does. The open-source monitoring products are Nagios and Zabbix, the common commercial ones PRTG and SolarWinds, and the cloud-native one Datadog. They differ in price and polish, and the job underneath is identical.

They watch in three ways. A ping, an ICMP echo, asks whether a device answers at all. SNMP, the simple network management protocol, polls a device for counters: interface up or down, throughput, CPU, temperature, fan speed, how long it has been running. An agent installed on a server reports from inside the machine: a disk at ninety-eight percent, or a service that has stopped.

"A node is down" means the monitor stopped getting an answer from it, which is a claim about the monitoring system. Read the board against who is actually on the phone.

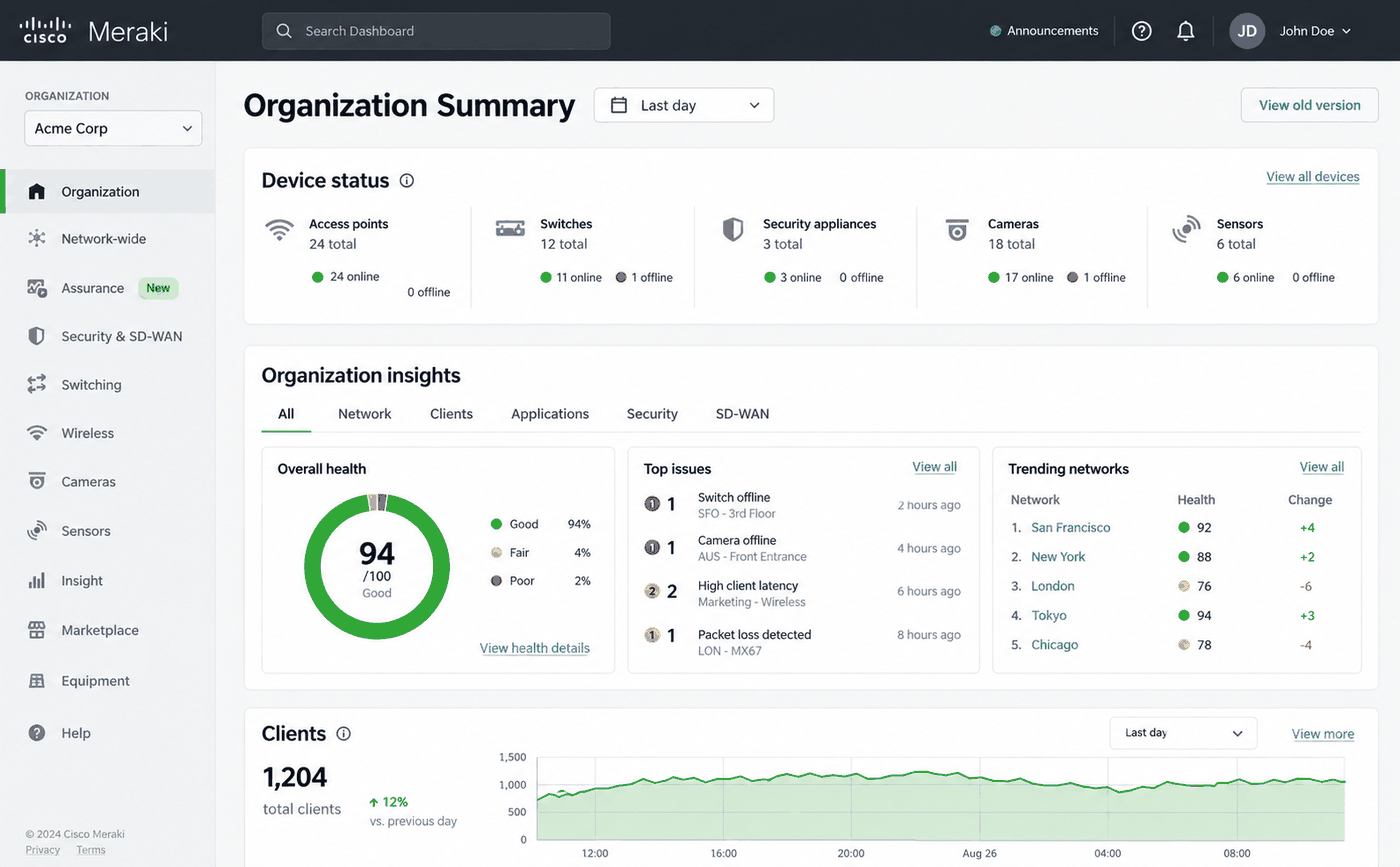
An illustration of a network monitoring dashboard showing device counts online and offline, an overall health score and a list of top issues including a switch offline and a camera offline.
An illustration of the kind of board you will be handed. What you are reading it for is the count, because that is what tells you whether you have one broken laptop or one broken floor. Five tickets off a floor whose switch is already listed as down are one incident, and working them as five is how an outage runs for an hour before anyone names it.

Cisco and Meraki are trademarks of Cisco Systems, Inc. ServiceDesk Simulator is not affiliated with, endorsed by, or sponsored by them.

The board against the phones

Board shows redBoard is all green
Users complaining Start at the first red thingThe fault is below the monitoring
Nobody complaining A false alert, a node nobody uses, or out of hoursQuiet
One switch failing lights thirty red alerts for machines that are perfectly healthy behind it, so look at the first red thing and not the thirtieth. And a green board while a floor is on the phone means a patch lead, a wireless controller, a DNS record or an application nobody wrote a check for.

Read the uptime beside the alert. A switch showing six minutes restarted itself a few minutes ago, and nobody told you.

One broken laptop, or one broken floor

Every ticket arrives describing one person's experience, and that person can see one screen, their own. So you ask whether anybody near them has the same problem, before you diagnose anything.

The answer to "is anyone near you seeing this?"

One person

  • A device problem, or an account problem.
  • Their laptop, their profile, their cable, their password.
  • Work the machine in front of them.

A group

  • An infrastructure problem, and every minute you spend on their laptop is wasted.
  • Ask what they share: floor, building, application, wireless network, department, laptop model, start time.
  • Work the thing they have in common.
The question takes ten seconds. Same department usually means the same file share and the same group membership; same laptop model means the same driver; same start time usually means the same change.

Then read the queue as a whole instead of one ticket at a time. Three tickets that say "WiFi keeps dropping", "my video call died" and "the VPN disconnected" look like three unrelated faults and are frequently one access switch. The descriptions differ because the users describe whatever they happened to be doing when the network went away.

Watch the clock, not just the words. Tickets that arrive inside the same ten minutes are related until proven otherwise, however different they sound. Tickets spread across a week that sound identical are usually a coincidence.

Declaring a major incident

Once you believe it is one fault affecting many people, there is a second job sitting on top of the repair: running the incident.

The tempo of a major incident

Declare
Say what is affected
Give an ETA
Fix it
Say it is fixed
Review
Every update lands when you said it would, even with nothing new to report. "Still investigating, next update at 11:30" is a good message. Silence is what makes people phone the desk, which makes the desk slower, which makes the outage longer.

Declare early. Every organization has a threshold, usually a critical service unavailable or a whole site affected. Raising one that turns out to be a floor switch costs a short call. Not raising one for ninety minutes while you work quietly costs the company the ninety minutes, and costs you the trust of everyone who was not told.

A declared incident has roles, and on a large one they are different people. The incident commander decides what happens next and keeps everyone pointed the same way, while other people do the fixing. The comms lead writes the updates, so the person elbow-deep in the fault has one job. On a small desk one person wears both hats, and the updates still go out on schedule.

Say what is affected, what is not, what you are doing, and when you will next update. Give a rough ETA and label it as an estimate. People ask so they can decide whether to wait, go for lunch, or drive to another office.

Say that you fixed it. Spotting the dead switch, rebooting it and saying nothing feels efficient. Meanwhile forty people lost an hour, a dozen rang the desk, three escalated to their managers, and no record exists of what happened or why.

Afterwards there is a review, usually called a blameless postmortem: what broke, what the impact was, how it was found, what the underlying cause was, and what stops it next time. Blameless means the write-up names causes and not people. Write your part honestly, including the twenty minutes you spent on the first user's laptop, because the review is only worth holding if it is accurate.

Part two

How this works here

The Server Room tool in this app: its four tabs, the path the topology view draws, and which real piece of kit each node stands in for.

The Server Room panel

The tool is in the Tools menu as Server Room, and it opens on four tabs: Overview, Topology, Devices and Servers.

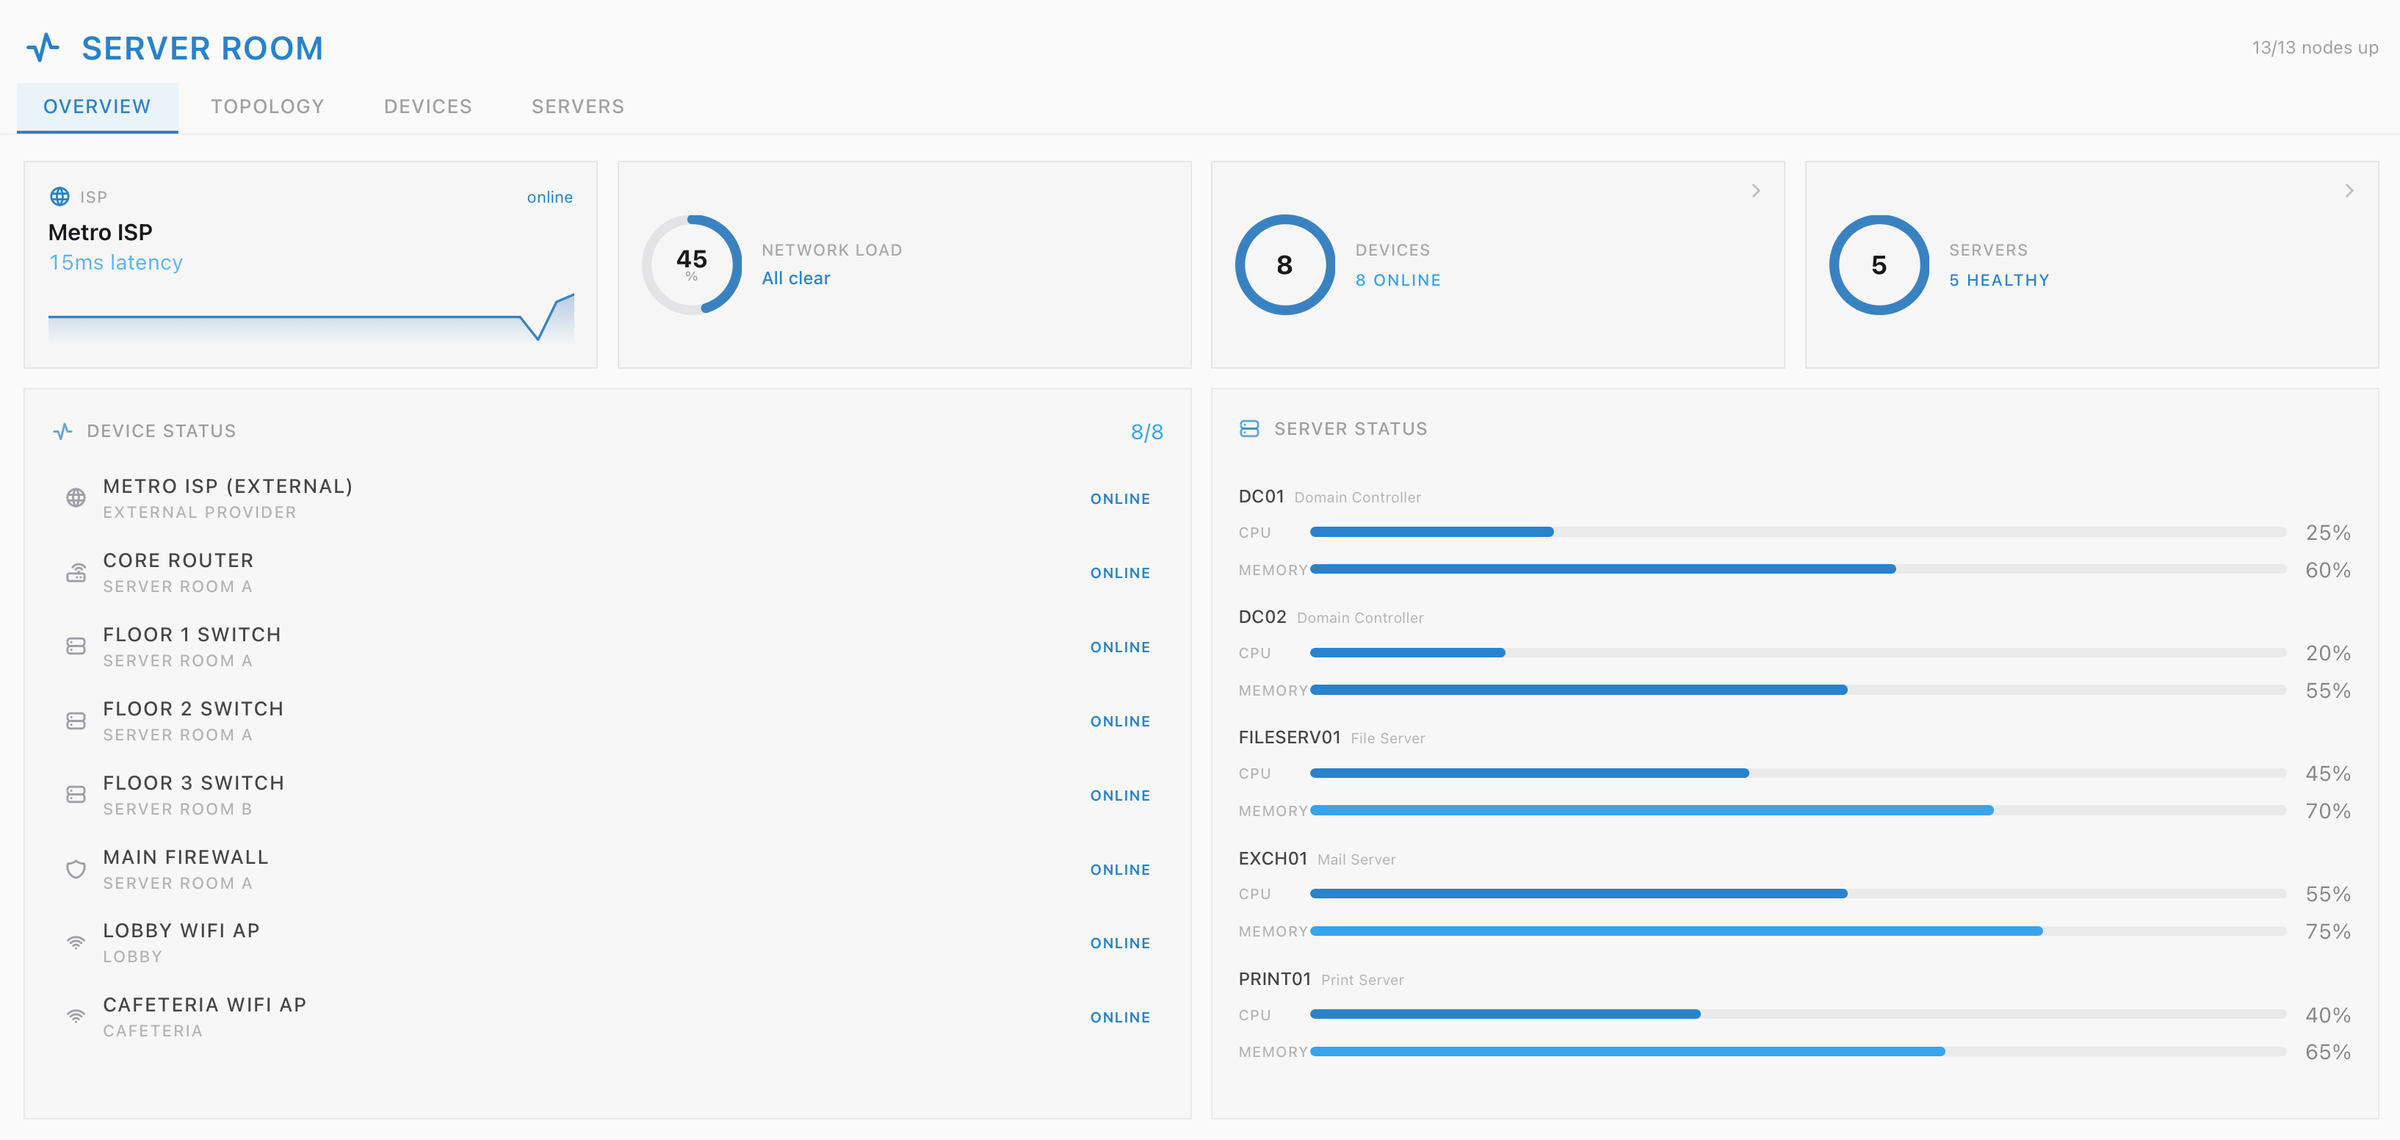
Overview is the dashboard. The ISP card, for the internet service provider that sells the building its connection, carries a live latency figure and a small sliding chart, Network Load reads All clear or Needs attention, and two rings carry the device and the server totals with how many of each are up written beside them. Beneath those, Device Status lists every piece of network equipment with its state and Server Status lists each server with its CPU and Memory meters. The header keeps a running count of nodes up. Confirming an upstream outage is left to you: the status line for an ISP outage appears once you have run the ISP check on the Devices tab.

The Overview tab. An ISP card reads Metro ISP, 15ms latency, online. A Network Load dial reads 45 percent and All clear. Two counters read 8 devices, 8 online and 5 servers, 5 healthy. A Device Status list shows all eight devices marked ONLINE, from Metro ISP (External) down to Cafeteria WiFi AP. A Server Status panel shows CPU and memory bars for DC01, DC02, FILESERV01, EXCH01 and PRINT01. The header reads 13 of 13 nodes up.
Read the top row before you read a single row below it. Thirteen of thirteen nodes up, with the load clear, means no outage is running, so the ticket in front of you belongs to one person and one machine. Skip this screen and you can spend twenty minutes on one user's laptop while a counter up here has been telling you all along that forty people are off.

Tracing the path on the Topology tab

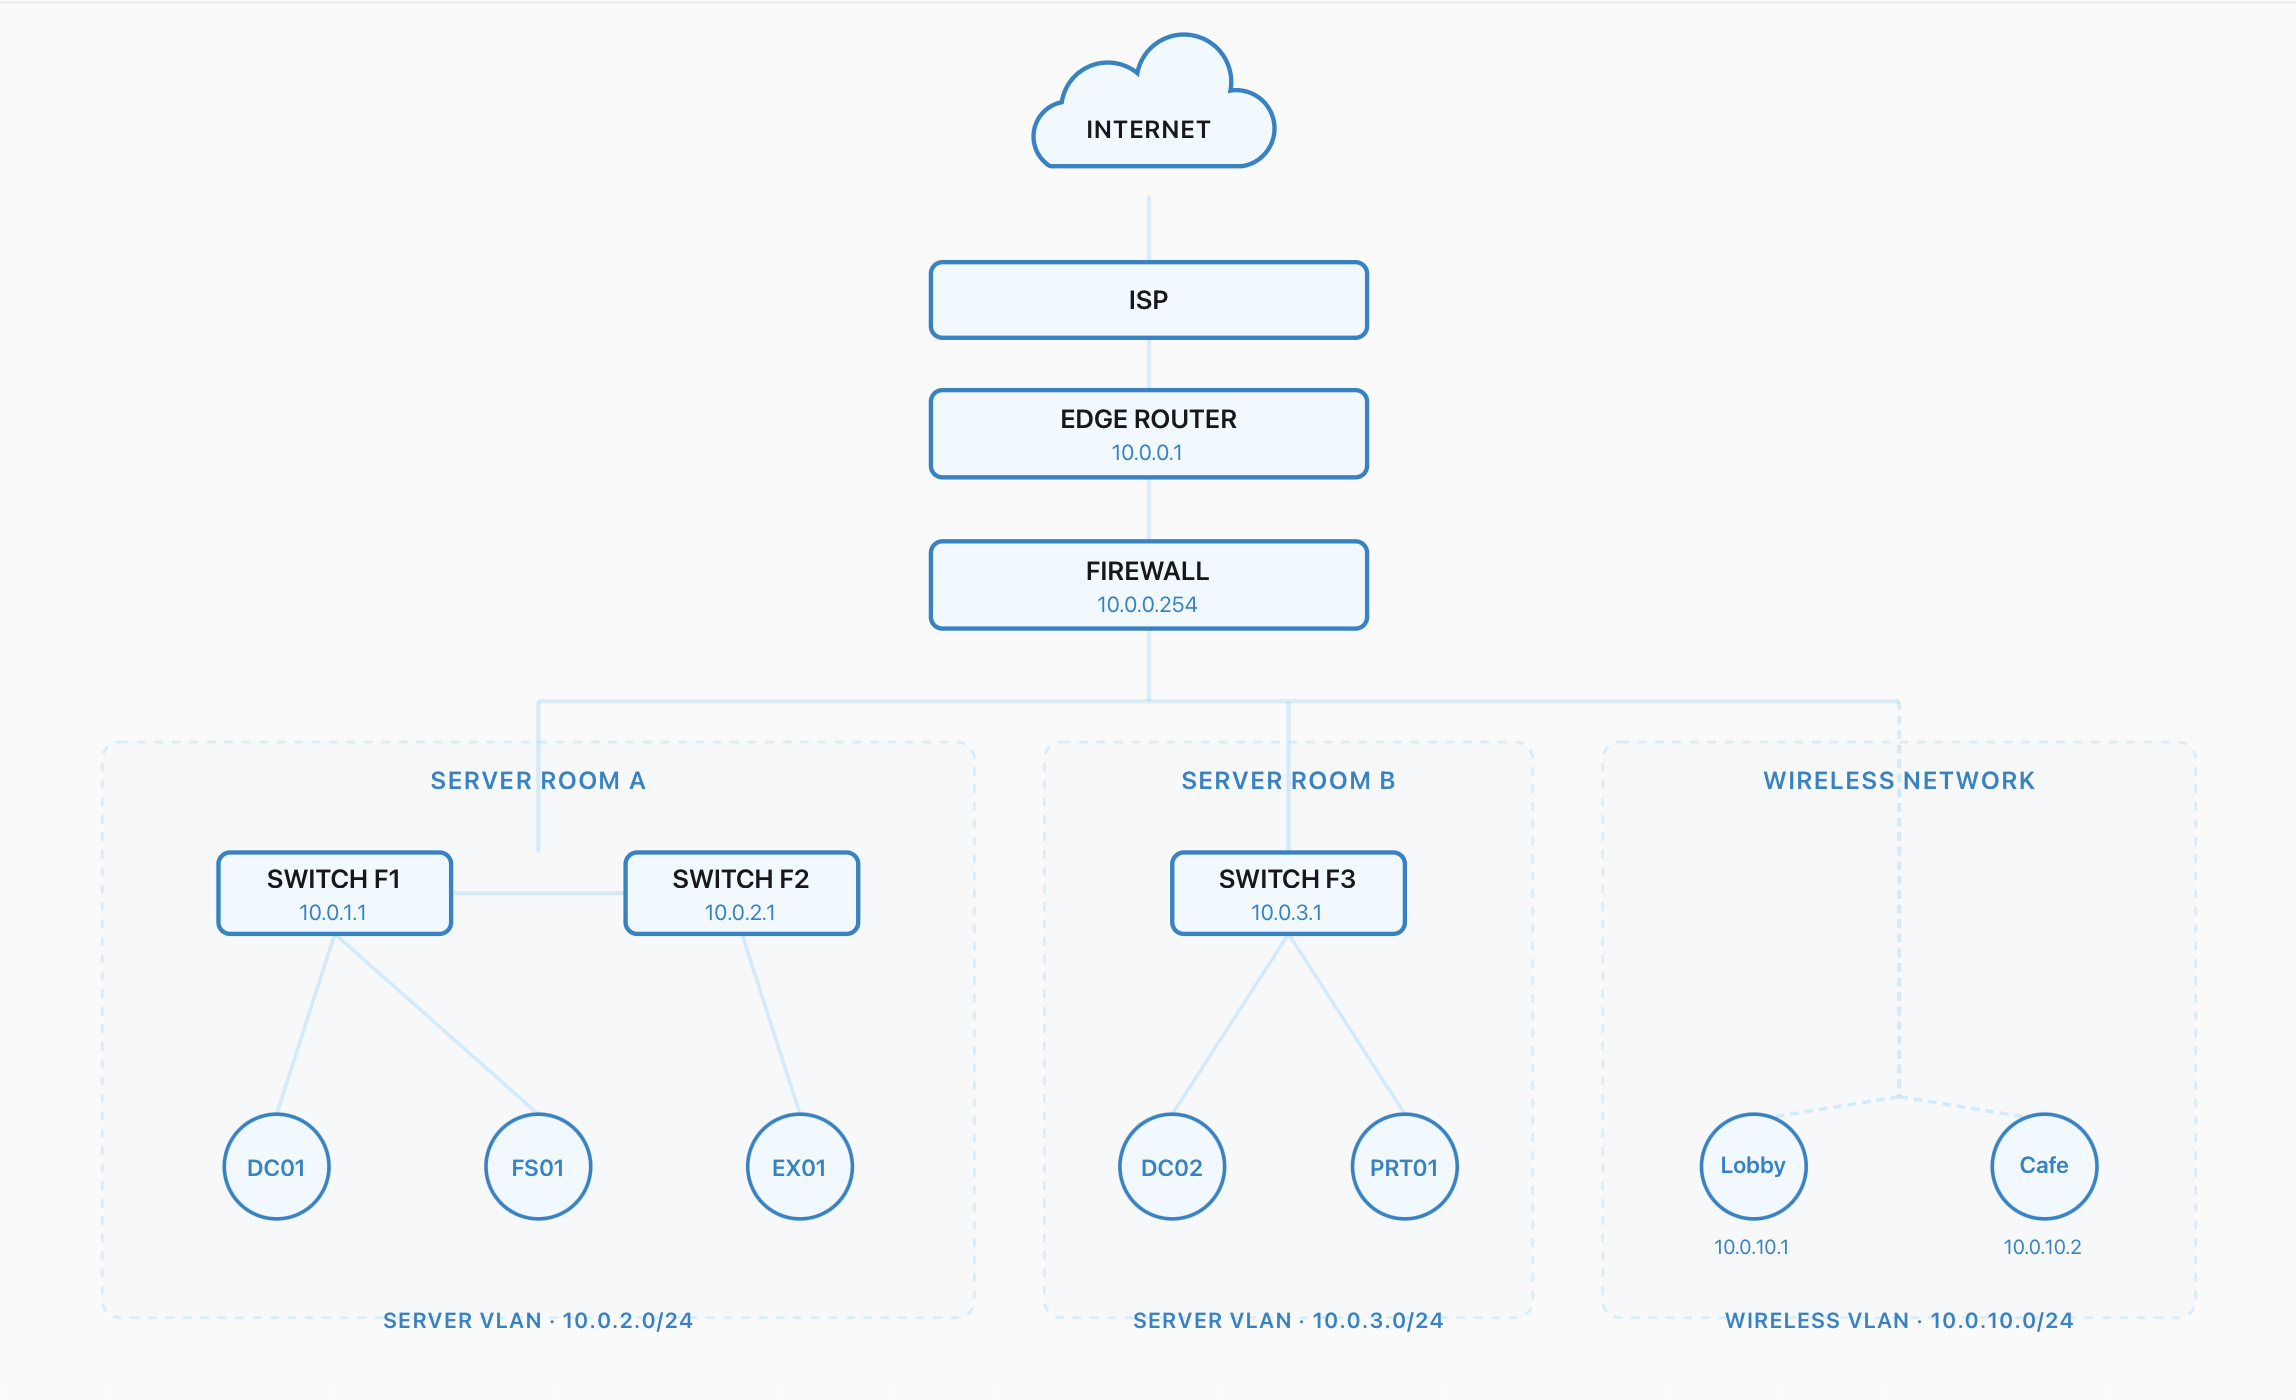
Topology draws the path top to bottom, and it is worth tracing with a finger the way part one asked you to: INTERNET, the ISP, EDGE ROUTER, FIREWALL, and then a horizontal bus fanning out to three zones, SERVER ROOM A, SERVER ROOM B and WIRELESS NETWORK, each tagged with its subnet such as the SERVER VLAN at 10.0.2.0/24.

The Topology tab. INTERNET sits at the top, then a single column of ISP, EDGE ROUTER 10.0.0.1 and FIREWALL 10.0.0.254, which fans out to three boxed zones. SERVER ROOM A holds SWITCH F1 10.0.1.1 and SWITCH F2 10.0.2.1 with DC01, FS01 and EX01 hanging beneath them. SERVER ROOM B holds SWITCH F3 10.0.3.1 with DC02 and PRT01. WIRELESS NETWORK holds Lobby 10.0.10.1 and Cafe 10.0.10.2. Each zone is tagged with its VLAN.
Everything above the fan-out is shared by everybody; everything below it belongs to one zone. So find the lowest box on this drawing that still sits above every person who is complaining. Start higher than that and you are rebooting kit that was never in their path.

What each level of that drawing tells you

Internet and ISP The carrier's, and the first thing to check, because an upstream fault is theirs to fix.
Edge router The last device you own. Everybody affected, everywhere, points at this or the firewall.
Firewall Everything below it is inside.
Zones Each holds its own switches and subnet. One zone dark is one group of people.
Machines Servers and access points on those switches. One of these dark takes one service down while the network around it keeps running.
A node that is up draws blue, a node that is down dim slate, and one part way through a restart a paler blue. Find the dim box that sits above everybody who is complaining.

The two equipment tables

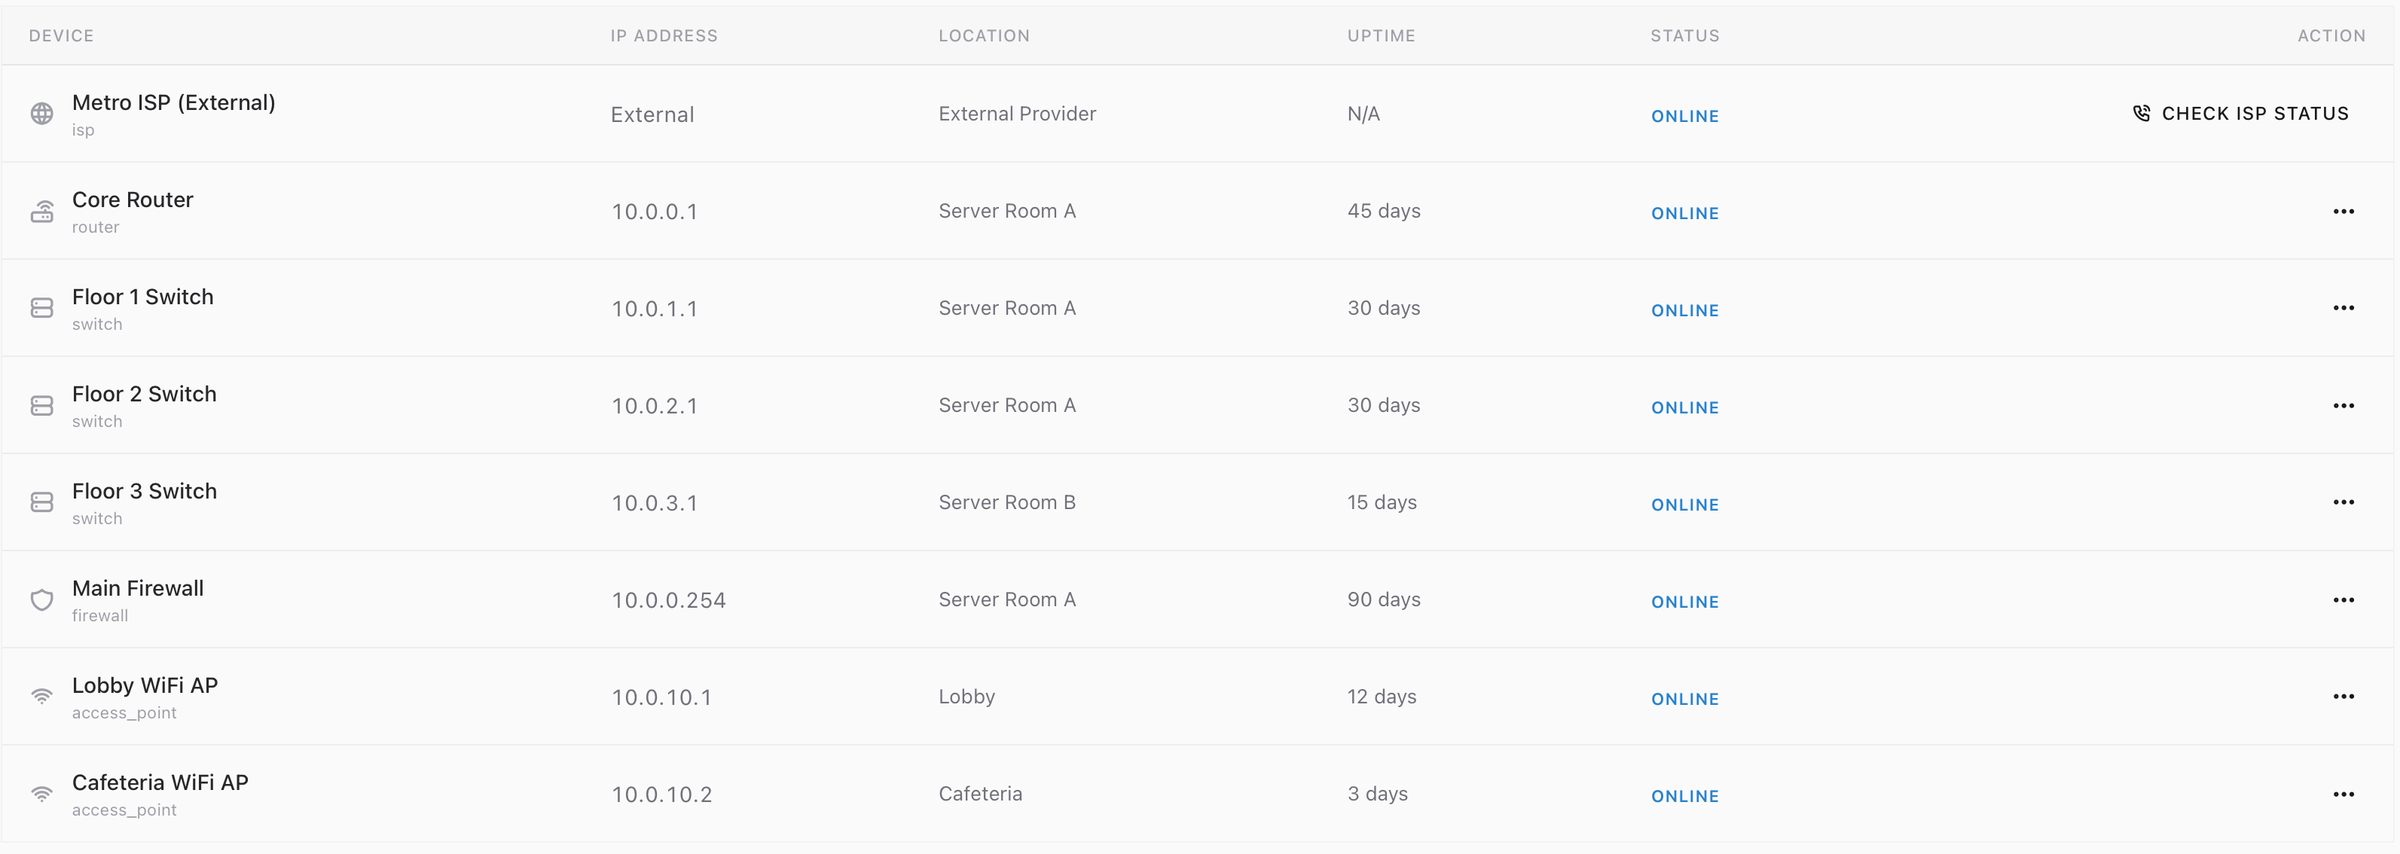
Devices is the equipment table, with columns for the Device, its IP Address, its Location, its Uptime, its Status and an Action. Each row that can be power-cycled has a three-dot menu, and what it offers depends on the state of that row: a device that is up offers reboot and shut down, one already off offers power on, and one part way through a restart keeps its menu shut until it settles. The ISP row is the exception: its one action reads check isp status, which is how you ask whether the fault is upstream before touching anything of your own.

The Devices tab table with columns DEVICE, IP ADDRESS, LOCATION, UPTIME, STATUS and ACTION. Eight rows: Metro ISP (External), External, External Provider, uptime N/A; Core Router 10.0.0.1 in Server Room A, 45 days; Floor 1 Switch 10.0.1.1 in Server Room A, 30 days; Floor 2 Switch 10.0.2.1 in Server Room A, 30 days; Floor 3 Switch 10.0.3.1 in Server Room B, 15 days; Main Firewall 10.0.0.254 in Server Room A, 90 days; Lobby WiFi AP 10.0.10.1 in the Lobby, 12 days; Cafeteria WiFi AP 10.0.10.2 in the Cafeteria, 3 days. Every row reads ONLINE. The Metro ISP row carries a CHECK ISP STATUS action; every other row carries a three-dot menu.
Uptime dates the last restart of every row. A firewall up ninety days is not today's fault. An access point up three days restarted itself last week and nobody raised a ticket about it, so the lobby WiFi complaint you keep closing as user error has a pattern behind it. Any uptime shorter than the problem is a device telling you it went down once already.

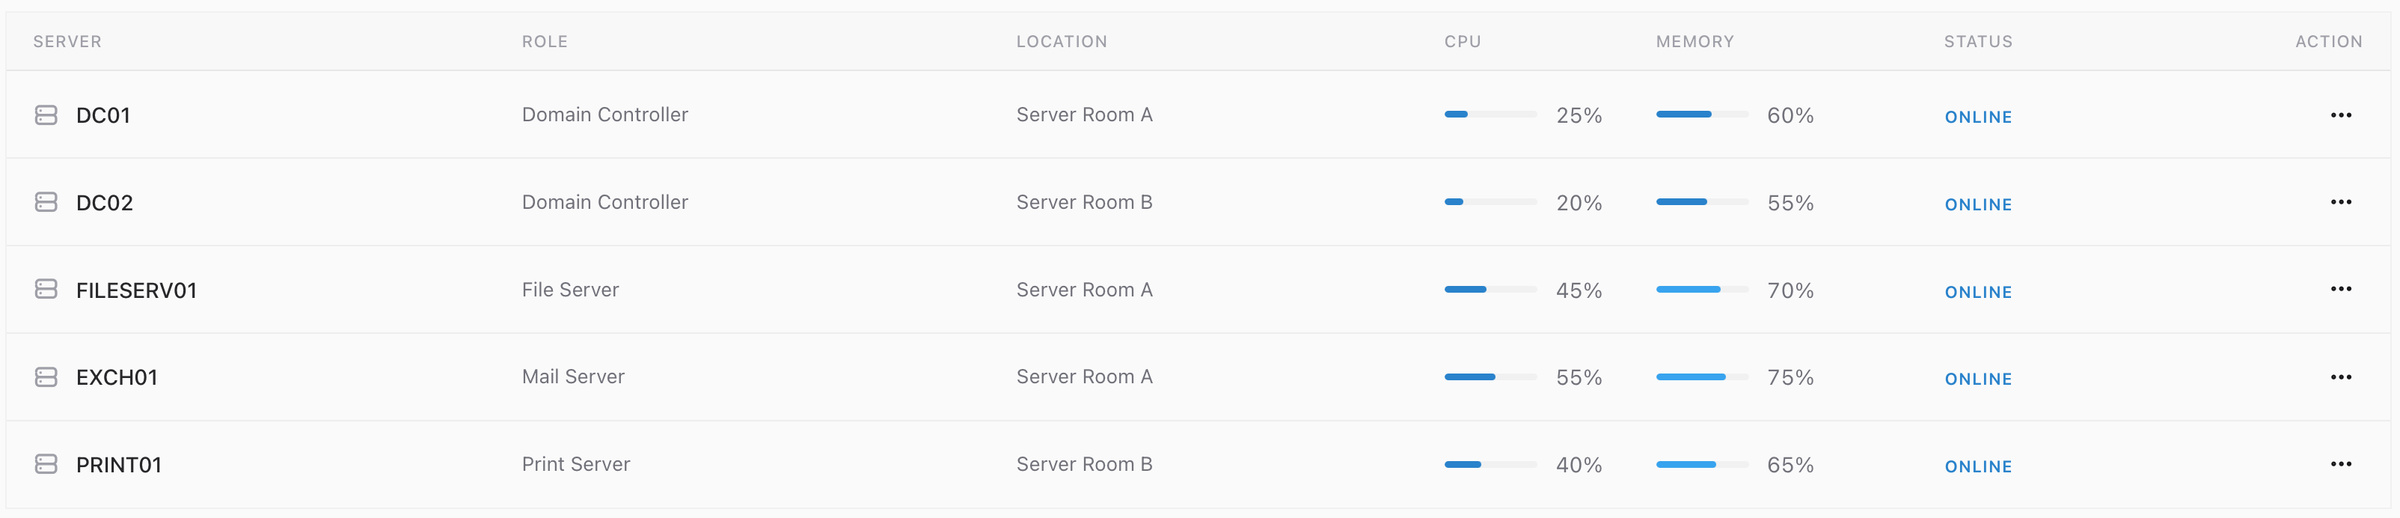
Servers is the same idea for the five servers, with a Role column and separate CPU and Memory meters. Two of them are a Domain Controller, which is the sim being quietly accurate about how domains are actually built, and the others are the File Server, the Mail Server and the Print Server.

The Servers tab table with columns SERVER, ROLE, LOCATION, CPU, MEMORY, STATUS and ACTION. Five rows: DC01, Domain Controller, Server Room A, CPU 25 percent, memory 60 percent; DC02, Domain Controller, Server Room B, CPU 20 percent, memory 55 percent; FILESERV01, File Server, Server Room A, CPU 45 percent, memory 70 percent; EXCH01, Mail Server, Server Room A, CPU 55 percent, memory 75 percent; PRINT01, Print Server, Server Room B, CPU 40 percent, memory 65 percent. Every row reads ONLINE, and each carries a three-dot menu.
Match a complaint to a role, never to a hostname. Nobody on our floor can print is the Print Server row whatever the box happens to be called, and cannot log in anywhere is one of the two Domain Controllers. Note where those two sit: one in each room, which is the only redundancy anywhere on this screen, and the reason a whole company losing sign-in is rarer than a whole company losing mail.

What each node stands in for

In the Server Room panelWhat it is in a real rack
Metro ISP (External) The carrier circuit and the demarcation point where their responsibility ends and yours begins.
Edge Router, 10.0.0.1 The last device you own before the traffic leaves. The Devices tab calls this same row Core Router, so match it by 10.0.0.1.
Main Firewall, 10.0.0.254 The perimeter firewall, which in a real rack is normally a pair.
Floor 1, Floor 2 and Floor 3 Switch Access switches in the floor closets, each uplinked to the core. One of these failing is one floor going dark.
Lobby and Cafeteria WiFi AP Wireless access points on their own VLAN, which in a real network would answer to a controller.
DC01 and DC02 Active Directory domain controllers. Every sign-in, group policy and permission check goes through one of these.
FILESERV01 The file server behind the mapped drives users call "the H drive".
EXCH01 The mail server, Microsoft Exchange in most on-premises shops.
PRINT01 The print server holding the shared print queues for the site.
Server Room A and Server Room B Two rooms holding the racks. They are redundant only if their power and uplinks genuinely differ.

Part one's rack carries four things this tab leaves out, and an incident review asks about all four. Out-of-band management is a card inside the server with a network address of its own, reachable when the machine will not boot, and it is what keeps a 2am reboot from being a drive to the office. A backup system, judged by the restores somebody has tested. A change record naming who altered what and when, which is the first thing anybody opens during an outage. And the door log on the room, answering the same question about people. On any incident that started this morning, ask for the change record early: the answer is usually sitting in it.

Redundancy reads differently here too. Two domain controllers are listed, and on a real network the point of the second one is that sign-ins carry on while the first is down. Failover is something planned and tested, so read each pair on this tab as an inventory and ask what would still be working if the left-hand node stopped. The physical half of that question is back in part one: which PDU a device is fed from, and whether one patch lead is the only thing holding a floor up. The alerts themselves come out of a monitoring product on a real desk, Nagios or PRTG in most shops, and the work there is reading a screen of them and writing the one sentence that goes in the ticket.

Part three

Practice

Read a queue that is really one incident, find the node behind it, and close the loop with the people who reported it.

Open this module in the simulator